Создаем в Visual Studio WPF проект, назовем его Collector.
В файл MainWindow.xaml копипастим следующий код:
<Window x:Class="Collector.MainWindow"
        xmlns="http://schemas.microsoft.com/winfx/2006/xaml/presentation"
        xmlns:x="http://schemas.microsoft.com/winfx/2006/xaml"
        xmlns:d="http://schemas.microsoft.com/expression/blend/2008"
        xmlns:mc="http://schemas.openxmlformats.org/markup-compatibility/2006"
        xmlns:local="clr-namespace:Collector"
        mc:Ignorable="d"
        Title="Collector.exe" Height="720" Width="1380">
    <Grid Margin="0,0,0,0" Height="700" Width="1380">
        <Button x:Name="button1" Content="Download" HorizontalAlignment="Left" Height="32.699" Margin="603.267,646,0,0" VerticalAlignment="Top" Width="102.768"/>
        <Button x:Name="button2" Content="Open file" HorizontalAlignment="Left" Height="32.699" Margin="816.589,646,0,0" VerticalAlignment="Top" Width="102.768"/>
        <Label x:Name="label1" Content="Symbol" HorizontalAlignment="Left" Height="32.699" Margin="30.256,646,0,0" VerticalAlignment="Top" Width="59.17"/>
        <Label x:Name="label2" Content="Date" HorizontalAlignment="Left" Height="32.699" Margin="277.833,646,0,0" VerticalAlignment="Top" Width="63.841"/>
        <TextBox x:Name="textBox1" HorizontalAlignment="Left" Height="24.913" Margin="117.453,646,0,0" TextWrapping="Wrap" Text="SBER" VerticalAlignment="Top" Width="94.983"/>
        <TextBox x:Name="textBox2" HorizontalAlignment="Left" Height="24.913" Margin="359.131,646,0,0" TextWrapping="Wrap" Text="2019.08.06" VerticalAlignment="Top" Width="94.983"/>
        <WebBrowser x:Name="web1" HorizontalAlignment="Left" Height="640" VerticalAlignment="Top" Width="1380"/>

    </Grid>
</Window>
А в файл MainWindow.xaml.cs :
using System;
using System.Collections.Generic;
using System.Linq;
using System.Text;
using System.Threading.Tasks;
using System.Windows;
using System.Windows.Controls;
using System.Windows.Data;
using System.Windows.Documents;
using System.Windows.Input;
using System.Windows.Media;
using System.Windows.Media.Imaging;
using System.Windows.Navigation;
using System.Windows.Shapes;
using System.Text.RegularExpressions;
using System.Xml;
using System.IO;
using System.Configuration;
using System.Web;
using System.Net;
using Microsoft.Win32;

namespace Collector
{
    public partial class MainWindow : Window
    {
        static string sLogFile = "collector.log";

	//загружаем хтмл-визуализатор в веб-браузер контрол
        public MainWindow()
        {
            InitializeComponent();

            button1.Click += btn1_Click;
            button2.Click += btn2_Click;

            string sDir = AppDomain.CurrentDomain.BaseDirectory;
            web1.Navigate("file:///" + sDir + "test_graph.htm");
        }

	//загружаем веб-страницу с котировками с сайта kyptrader.ru, меняем расположение колонок, сохраняем в файл
        private void btn1_Click(object sender, RoutedEventArgs e)
        {
            string sym = textBox1.Text;
            string dat = textBox2.Text;

            string url = "http://kyptrader.ru/Quotes/Look?Code=" + sym + "&Date=" + dat;
            string data = RestGet(url);
            if (string.IsNullOrEmpty(data))
            {
                log("error reading " + url);
                MessageBox.Show("error reading " + url);
                return;
            }

            string sFile = sym + "_" + dat + ".csv";
            StreamWriter sw = new StreamWriter(sFile, false, Encoding.GetEncoding(1251));

            string ord = @"<tr><td>(.*?)<\/td><td>(.*?)<\/td><td>(.*?)<\/td><\/tr>";
            Regex reg = new Regex(ord, RegexOptions.Singleline);
            var cols = reg.Matches(data);
            double dStep = 0, dMax = 0, dMin = 0, dStart = 0, dEnd = 0, d, dPrev = 0, dif;
            int i = 0;
            foreach (Match m in cols)
            {
                if (m.Groups.Count == 4)
                {
                    sw.WriteLine(string.Format("{0};{1}", m.Groups[2].Value, m.Groups[1].Value));
                    bool bSuc = double.TryParse(m.Groups[2].Value, out d);
                    if (!bSuc) bSuc = double.TryParse(m.Groups[2].Value.Replace(".", ","), out d);
                    if (bSuc)
                    {
                        if (i == 0)
                        {
                            dStart = d;
                            dMax = d;
                            dMin = d;
                        }
                        else
                        {
                            if (dMax < d) dMax = d;
                            if (dMin > d) dMin = d;
                            dif = Math.Abs(d - dPrev);
                            if (dStep < dif) dStep = dif;
                        }
                        dEnd = d;
                        dPrev = d;
                        i++;
                    }
                }
            }
            sw.Close();

            string res = string.Format("{6}: n={0} dStart={1} dEnd={2} dStepMax={3} dMax={4} dMin={5}", i, dStart, dEnd, dStep, dMax, dMin, sFile);
            log(res);
            MessageBox.Show(res);
        }

	//загружаем файл в визуализатор
        private void btn2_Click(object sender, RoutedEventArgs e)
        {
            string res, data;
            OpenFileDialog openFileDialog = new OpenFileDialog();
            if (openFileDialog.ShowDialog() == true)
            {
                data = File.ReadAllText(openFileDialog.FileName);
                web1.InvokeScript("ext_load", data);
                res = Analyze(data, 15);
                web1.InvokeScript("ext_alert", res);
            }
        }

	//логируем
        static void log(String s)
        {
            try
            {
                StreamWriter sw = new StreamWriter(sLogFile, true, Encoding.GetEncoding(1251));
                sw.WriteLine(string.Format("{0:yyyy-MM-dd HH:mm:ss} {1}", DateTime.Now, s));
                sw.Close();
            }
            catch (Exception se)
            {
                Console.WriteLine(se.Message);
            }
        }

        //считать веб-страницу
        static string RestGet(string url)
        {
            HttpWebRequest req = (HttpWebRequest)WebRequest.Create(url);
            req.Proxy.Credentials = System.Net.CredentialCache.DefaultNetworkCredentials;
            string result = null;
            using (HttpWebResponse resp = (HttpWebResponse)req.GetResponse())
            {
                StreamReader reader = new StreamReader(resp.GetResponseStream());
                result = reader.ReadToEnd();
            }
            return result;
        }

	//анализируем данные
        private string Analyze(string data, int inGroup)
        {
            string res = "done";
            double dStep = 0, dMax = 0, dMin = 0, dStart = 0, dEnd = 0, d, dPrev = 0, dif;
            string[] arr = data.Split('\n');
            int len = arr.Length / inGroup;
            double[] y = new double[len];


            return res + arr.Length;
        }
    }
}
Компилируем. В папку с выполняемым файлом добавляем страницу test_graph.htm со следующим кодом:
<!DOCTYPE html>
<html>
<head>
    <meta http-equiv="Content-Type" content="text/html; charset=utf-8"/>
    <title>Files compare</title>
    <style type="text/css">
        body { background-color:#fff; }
        #file1 { width: 45%; height:100px; margin-right:10px; float:left; border:1px solid #ccc; }
        #result  {width: 45%; height: 100px; float:left; border:1px solid #ccc;}
        #canvas1 { border:1px solid #cfc; }
    </style>
    <script type="text/javascript" src="jquery-1.11.1.min.js"></script>
</head>
<body onload="my_onload()">
    <div id="1">Fill a box with data, click "Show".</div>
    <textarea id="file1">219.87;10:00:00
219.91;10:00:02
220.33;10:00:36</textarea>
scale <input id="scale" type="text" />
    <a href="#" onclick="return show();">Show</a>
    <div id="result">results</div>
    <div style="clear:both;"></div>
    <canvas id="canvas1" width="800" height="600"></canvas>

<script type="text/javascript">
    function my_onload() {
        return false;
    }
    function show() {
        var scale = $("#scale").val();
        var s1 = $("#file1").val();
        var arr1 = s1.split("\n");

        var iScale = parseInt(scale, 10);
        if( isNaN(iScale) || iScale < 1 || iScale > 1000 ) iScale = 1;
        var len = parseInt("" + arr1.length / iScale, 10);
        if( len < 1 ) {
            $("#result").html("bad totlen=" + arr1.length);
            return;
        }

        var dd = new Array();
        var y0 = 1, y1 = 1;
        for (var j = 0; j < 100000 && j < arr1.length; j++) {
            var aa = arr1[j].split(";");
if(aa.length <= 1 ) { break; }
            var y = aa[0] * 1;
            if( j == 0 ) {
                y0 = y;
                y1 = y;
            }
            else {
                if( y0 > y ) y0 = y;
                if( y1 < y ) y1 = y;
            }
            dd.push(y);
        }
        var extra = (y1 - y0) * 0.01;
        y0 -= extra;
        y1 += extra;
        $("#result").html("totlen=" + arr1.length + ", scale=" + iScale + ", len=" + len + ", y0=" + y0 + ", y1=" + y1 + ",extra=" + extra);

        //calc sliding average - long
        var dd_2 = new Array();
        var sum = 0, slide = iScale * 20;
        for (var j = 0; j < 100000 && j < dd.length; j++) {
            sum += dd[j];
            if( j >= slide)
                sum -= dd[j - slide];
            dd_2.push(sum / (j < slide ? (j + 1) : slide));
        }

        //calc sliding average - short
        var dd_3 = new Array();
        sum = 0;
        slide = iScale * 5;
        for (var j = 0; j < 100000 && j < dd.length; j++) {
            sum += dd[j];
            if( j >= slide)
                sum -= dd[j - slide];
            dd_3.push(sum / (j < slide ? (j + 1) : slide));
        }

        //prepare canvas
        var cnv = document.getElementById("canvas1");
        cnv.width = 2*len + 1;
        GRAPHIX.AX_CL = "#ffff00";
        GRAPHIX.PADDING = 0;
        GRAPHIX.drawAxes('canvas1');

        //draw our data
        var iDisplay = iScale - 1;
        var opt2 = { "x0": 0, "x1": 2*len, "y0": y0, "y1": y1, "color": "#ff0000", "style": "line" };
        var data2 = new Array();
        for (var j = 0; j < 100000 && j < dd.length; j++) {
            if( j % iScale == iDisplay ) {
                var x = j / iScale;
                var y = dd[j];
                data2.push(new Array(2*x, y));
            }
        }
        GRAPHIX.drawData('canvas1', data2, opt2);
        if( iScale == 1) return false;

        //draw average
        var opt3 = { "x0": 0, "x1": 2*len, "y0": y0, "y1": y1, "color": "#ff00ff", "style": "line" };   //average iScale
        var opt4 = { "x0": 0, "x1": 2*len, "y0": y0, "y1": y1, "color": "#ffffff", "style": "line" };   //long slide
        var opt5 = { "x0": 0, "x1": 2*len, "y0": y0, "y1": y1, "color": "#00ff00", "style": "line" };   //short slide
        var data3 = new Array();
        var data4 = new Array();
        var data5 = new Array();
        var yav = 0;
        for (var j = 0; j < 100000 && j < dd.length; j++) {
            yav += dd[j];
            if( j % iScale == iDisplay ) {
                var x = j / iScale;
                data3.push(new Array(2*x, yav / iScale));
                yav = 0;
                data4.push(new Array(2*x, dd_2[j]));
                data5.push(new Array(2*x, dd_3[j]));
            }
        }
        //GRAPHIX.drawData('canvas1', data3, opt3);
        GRAPHIX.drawData('canvas1', data4, opt4);
        GRAPHIX.drawData('canvas1', data5, opt5);
        return false;
    }
    function ext_load(w) {
        //alert(w);
        $("#file1").val(w);
    }
    function ext_alert(w) {
        //alert(w);
        $("#result").html(w);
    }

    //простой модуль для рисования графиков на "холсте"
    if (typeof GRAPHIX == "undefined") {
        GRAPHIX = {
            PADDING: 20,        //отступ
            AX_BG: "#000000",   //фон
            AX_CL: "#00FF00",   //цвет осей
            //залить фон, нарисовать оси
            drawAxes: function(canvas) {
                var cnv = document.getElementById(canvas);
                var w = cnv.width;
                var h = cnv.height;
                var ctx = cnv.getContext('2d');

                ctx.fillStyle = this.AX_BG;
                ctx.fillRect(0, 0, w, h);
                ctx.strokeStyle = this.AX_CL;
                ctx.lineWidth = 1;
                //ctx.beginPath();
                ctx.moveTo(this.PADDING, 0);
                ctx.lineTo(this.PADDING, h);
                ctx.stroke();
                ctx.moveTo(0, h - this.PADDING);
                ctx.lineTo(w, h - this.PADDING);
                ctx.stroke();
            },
            //отобразить данные
            drawData: function(canvas, data, opt) {
                var cnv = document.getElementById(canvas);
                var w = cnv.width - this.PADDING;
                var h = cnv.height - this.PADDING;
                var x0 = opt.x0;
                var x1 = opt.x1;
                var y0 = opt.y0;
                var y1 = opt.y1;
                var dx = (x1 - x0);
                var dy = (y1 - y0);

                var ctx = cnv.getContext('2d');
                ctx.lineWidth = 1;
                ctx.strokeStyle = opt.color;
                ctx.fillStyle = opt.color;
                ctx.beginPath();

                for (var i = 0; i < data.length; i++) {
                    var r = data[i];
                    var x = r[0];
                    var y = r[1];
                    var l = w * (x - x0) / dx + this.PADDING;
                    var m = h - h * (y - y0) / dy - this.PADDING;

                    if (opt.style == "dots") {
                        ctx.fillRect(l, m, 3, 3);
                    }
                    else if (opt.style == "hist") {
                        ctx.moveTo(l, h);
                        ctx.lineTo(l, m);
                        ctx.stroke();
                    }
                    else if (opt.style == "line") {
                        if (i == 0) ctx.moveTo(l, m);
                        else {
                            ctx.lineTo(l, m);
                        }
                    }
                }
                if (opt.style == "line") ctx.stroke();
            },
            //отобразить текст
            drawTile: function(canvas, title, x, y, color, size) {
                var cnv = document.getElementById(canvas);
                var ctx = cnv.getContext('2d');
                ctx.fillStyle = color;
                ctx.font = size + "px Verdana";
                ctx.fillText(title, x, y);
            }
        }
    }

</script>
</body>
</html>
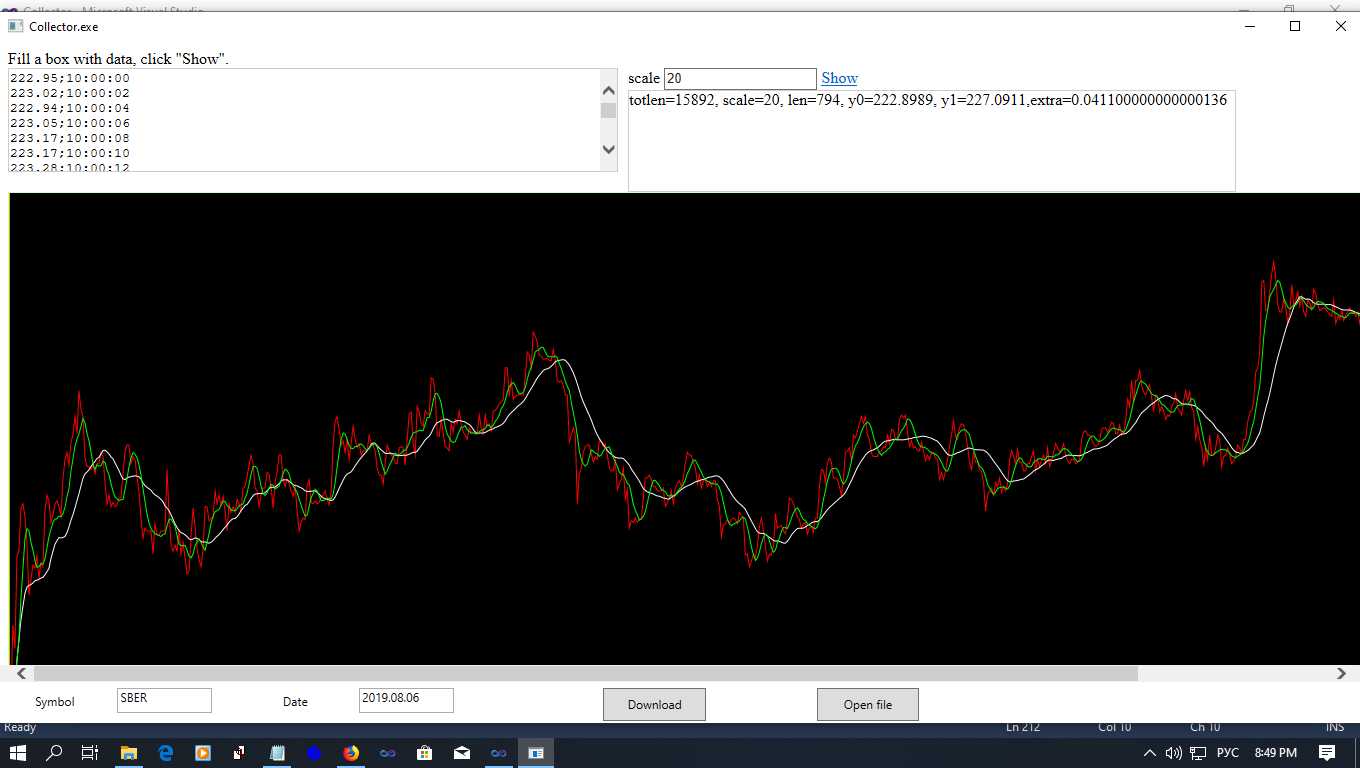
Имея такое приложение, мы можем загружать файлы с котировками с сайта kyptrader.ru ,
а потом делать из них графики


Но предварительно надо настроить отображение html5 в WebBrowser компоненте
(https://www.codeproject.com/Questions/707214/how-make-my-csharp-web-browser-to-support-html5).
В регистре
HKEY_LOCAL_MACHINE\SOFTWARE\Microsoft\Internet Explorer\MAIN\FeatureControl\FEATURE_BROWSER_EMULATION
            For 32bit OS

            *******OR*******

HKEY_LOCAL_MACHINE\SOFTWARE\Wow6432Node\Microsoft\Internet Explorer\MAIN\FeatureControl\FEATURE_BROWSER_EMULATION
            For 64bit OS

надо создать DWORD с именем Collector.exe, а потом писвоить значение 11001 decimal
(если не заработало, то пробуйте 10001).
Танцы с бубном никто не отменял.
Но предварительно надо настроить отображение html5 в WebBrowser компоненте
(https://www.codeproject.com/Questions/707214/how-make-my-csharp-web-browser-to-support-html5).
В регистре
HKEY_LOCAL_MACHINE\SOFTWARE\Microsoft\Internet Explorer\MAIN\FeatureControl\FEATURE_BROWSER_EMULATION
For 32bit OS
*******OR*******
HKEY_LOCAL_MACHINE\SOFTWARE\Wow6432Node\Microsoft\Internet Explorer\MAIN\FeatureControl\FEATURE_BROWSER_EMULATION
For 64bit OS
надо создать DWORD с именем Collector.exe, а потом писвоить значение 11001 decimal
(если не заработало, то пробуйте 10001).
Танцы с бубном никто не отменял.
Комментариев еще нет.